New Highs: Where Are We (and how’d we get here)?
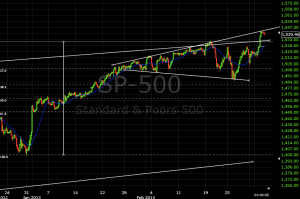
We’ve just broken into rarified air as the markets moved higher yesterday. The $1530 mark seemed troublesome in February, but this yesterday morning we blew through it as we hit a high of $1543.47 on the S&P, while we blazed new highs on the blue-chip Dow. It wasn’t easy getting here, and as I mentioned in an earlier blog post, there has been some volatility as we touched the lower trendline of the megaphone pattern on Feb 25th. We are now among distinguished company as we are coming up on the highs of 2000 and 2007, $1552 and $1576, respectively. Wall St. has made a pretty remarkable recovery, when you think about it, considering that Main St. hasn’t necessarily seen the same kind of recovery. The national unemployment rate has been hovering around 7.9%, whereas it was just under 5% in 2007 and closer to 4% in 2000. Indeed, it may be true that 8% is the new normal and we will never see pre-2007 unemployment levels again. I just can’t, however, endorse these new market highs as indicative as a general economic recovery. Label me all you want as a curmudgeon or a permabear, but hear me out for a second.
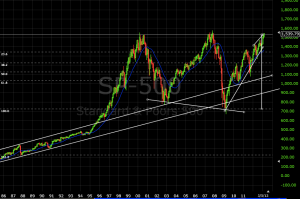
Let’s take a look at a very long-term chart:
This is a monthly chart of the S&P 500. As you can see, we were in a reasonable trading channel in the late 80s-early 90s. Something started clicking in 1995 and the markets shot up and never looked back, until, of course, late 2000-early 2001. What exactly that something was would probably make for a good post, but I won’t open that can of worms right now. Previous levels of resistance became support as we crashed down from the highs of 2000 to the lows of late 2002-early 2003. After peaking again in 2007, we crashed back down to the lower trendline of the 80s/90s trading channel for the crash of 2008. Clearly, this trading channel has served us well, so there must be something to it. If you back-calculate the channel, the return for the that late 80s-early 90s trend is about 7%. Which essentially means that if you put money in the market in the early 80s and took it out during the crash of 2008, you would average about an 7% return per year. That’s really not so bad and it’s pretty much what the benchmark is for what an ideal return is for the markets.
The question then becomes: is the stock market overvalued or is it undervalued? Since we seem to be nearing all-time-high levels, and way up above the 7% trendline, one could argue that the markets are overvalued at the moment. However, the current Price to Earnings ratio of the S&P 500 is around 17.5. That’s reasonable when you consider that a stock with a P/E under 20 is generally considered to be of fair value.
I would argue that the quantitative easing program by the Fed has artificially inflated equity prices and that when (not a matter of if) the Fed announces an easing of the easing, the markets will come back down to earth. This was evident on Feb. 25, when the Fed announced they were just considering weaning off the QE program. I’m not going to sit here and tell you QE hasn’t been a good thing, it’s clear that it has helped. What I am saying is that as soon as the Fed pulls the plug, there may be some unintended consequences.
Of course, technical analysis has its limits. It can only tell you where you currently are and how you got there. Technical analysis is not a crystal ball and cannot tell you where you will go. That part takes knowledge, experience, and a little bit of luck. The best we can do is make an educated guess as to where the markets will go when you consider the historical price movements and the overall economic outlook. The contrarian in me rejects the irrational exuberance of these new highs. It has been said that early morning traders trade on emotion and impulse, whereas late-day traders trade on experience and knowledge. Now, I’m not sure about the validity of that claim, but consider the intraday trading of last few days. We popped up early in the morning on March 6th, Feb 28th, Feb 27th and we dipped on late-day trading on Feb 28th, and Feb 25th.
If I had to predict where we’re heading, I’d argue we’d make new highs here and may even test the all-time-high of the S&P at $1576, possibly testing $1600. However, I expect to see an exhaustive gap up followed by a healthy pullback from these levels and a 61.8 fibonacci retracement to $1450 or lower to $1350. It’s only once we create a solid foundation, we’ll push to new highs. So I would be wary about adding money at these levels, so it may be best to keep equity levels where they are, possibly take profits.
It should be noted that I have no actual positions in any stocks mentioned (or unmentioned) nor will I be initiating any actual positions in the next 6 months. Furthermore, the information on this blog should not be considered financial advice. The main purpose of the blog is to educate its readership, myself included, about concepts and ideas that were previously unknown to me.


Excellent blog about investing, I am looking forward to learning more since I have so little experience and so many questions on different subjects. Pi-shaped is there any way users can contact you for private discussions on investing?
Hi Alex, thanks for reading! I don’t have much experience, either, but I’d be happy to impart anything I know to you. Email me at Pi.Shaped@gmail.com and I’ll try to respond as quick as I can.