Archive
The Exit: Knowing When to Fold ’em
or: What Goes Up, Must Come Down.
How do you know the right time to exit a position? Everything you hear is always about initiating the trade or what the next big stock will be, but rarely does anyone talk about what you’re supposed to do once you’re left holding the bag. Even if the trade generates profits, how do you know when is the best moment to realize your gains and take it off the table?
The simple answer is that you have no way of knowing when that “right” time is. A lot of people talk about how it’s a “gut feel” or that they “just know”, but that’s all hand-waving exercises at best and self-delusional at worst. Sure, the more experience you gain, the more often you will have encountered a similar situation and therefore better equipped to anticipate previously made errors. But knowing when to accept losses or realize gains is a crucial part of playing the stock market and even life itself (I know, we’re getting deep here).
It doesn’t matter who you are or what level of investor you are, you will inevitably make incorrect calls. Even the big guys make bad calls all the time. It’s also very, very rare to be right 100% of the time. So it’s best to accept the fact that you will make mistakes and you will make decisions that seem like a good idea at the time with all the available information. There are things you can do, however, to offset your losses or protect yourself when things go awry.
First and foremost, don’t hang it up after a tough loss. Realize that everyone makes a bad call here and there. Once you accept that fact, things will be a lot easier to deal with when they do unravel.
For downside protection, diversification is an important consideration when developing your portfolio. The laggards in your portfolio can be helped along with some star performers. It’s also okay to hit a single and double once in a while and even strike out, as long as you hit the home runs and grand slams once in a while. Indeed, it’s true in venture capital since it is said that 60% of a venture firm’s returns come from 10% of their capital. According to the National Venture Capital Association, 20% or less of a firm’s capital generates high returns. Of course, the type of investing you do in the stock market isn’t nearly as high risk as venture investing, but the concept is the same. Diversify your portfolio so as to mitigate losses. Diversification can take on different forms, too, including investing in different sectors, growth stages, or even investment vehicles (that is, perhaps investing in equities, treasuries, bonds, forex, etc.).
Hedging is another strategy to utilize for downside protection. This can take the form of inverse ETFs, such as ones linked here, or a volatility index, such as the VIX, explained well here, or by using a protective put. . Keep in mind leveraged ETFs aren’t built to be held for long periods of time, especially leveraged inverse ETFs. Their value decays and they are prone to wild swings. Just use these as tools for hedging your long positions when you’re unsure of market direction, but you still want long exposure.
Additionally, it helps to consider your timeframe for investing. Consider this diagram linked here from The New York Times. It illustrates yearly percentage return patterns in the S&P 500 going back to 1920. The basic premise of the diagram is that your returns on your investment are entirely dependent on what year you both initiate positions and exit positions. Let’s say you invested in 1980 and took your money out in 1984. Your return would be around 0-3% per year. That would have been a pretty crummy return on your investment. But let’s say you held on to your investment for 20 years. The return would come out to around 8% per year. Now that’s not bad. So in short, timing matters.
If you’ve recently taken a loss and your timeframe is long-term, pay no mind, you’ll make it up. If you’ve held on to some profitable stocks and you’ve got a short-term timeframe, take some profits off the table. So always pay attention to what your time frame is and you’ll be able to shrug off losses and take your gains.
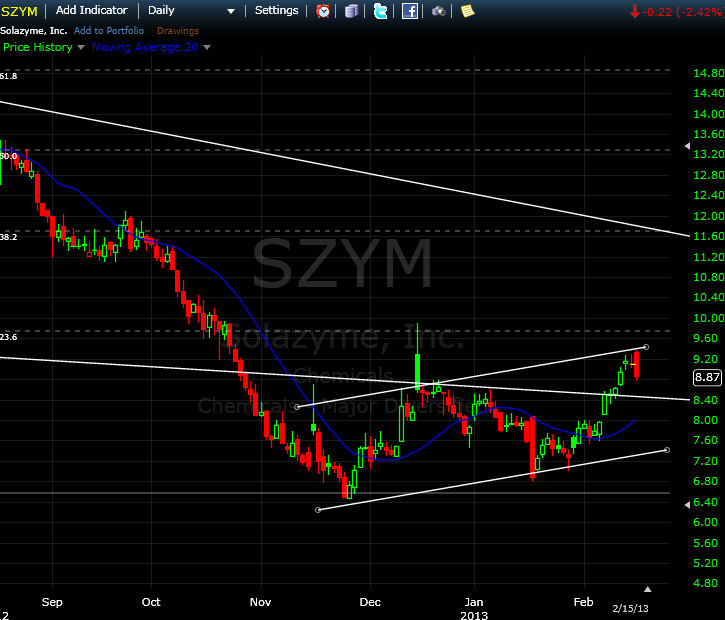
SZYM Daily, freestockcharts.com
I know it might seem like I talk up SZYM a lot here, but aside from my bullishness, I think it’s an educational stock. I half-expected a pullback from the recent run-up so I’m not too surprised by the dip in trading on Friday, 2/15, as we’re at levels of resistance. As I mentioned, if your timeframe is short-term, and you’re in under $8, Friday would have been a good time to get out. An astute trader would have seen the bullish indicators on 1/31 (20-day moving average, MACD, etc) and initiated a position. Further, the astute short-term trader would have anticipated a pullback at resistance levels and exited their position on Friday, 2/15. This would have provided a 10% return, possibly more, of realized gains.
However, as a long-term investor, I would be okay not taking any profits off the table since I would be looking to ride it up past the current price levels. So always keep your timeframe in mind.
Of course, there is nothing earth shattering, here, but these are important considerations when faced with a big loss or gain.
These concepts can even be applied to life itself. How do you know when to let go of a long-held personal or professional goal despite all odds seemingly against you? Simple: You don’t let go. You diversify your approach in attaining your goal, hedge your risks, and consider your timeframe for what you want to achieve. If one route proves difficult or doesn’t pan out how you’d like, have plan B, and even plan C ready to go. As it happens, my motivation for the Pi Shaped Blog is to diversify.
So if you’ve just been hit with a loss, stick with it. Most importantly: stay hungry, stay foolish.*
*Steve Jobs, Stanford Commencement Speech, 2005
SZYM: Technicals Turning Bullish
A few weeks ago I mentioned Solazyme to be an interesting play. Indeed, as of 2/11/13, SZYM is up around 14% since I posted on 1/26/13. The technicals have since turned slightly bullish and the price has now been hovering at a key level of resistance at $8.50. Check out the chart below:

SZYM Weekly, freestockcharts.com
The green arrows indicate bullish technicals and would have been a great time to enter the stock. The price price breached the 20-day Moving Average as shown by the top green arrow. The lower green arrow shows a bullish MACD.
If the bulls can break this key resistance here, we’re heading up to major resistance at around $9.60. One caveat here is if we cannot breach the $8.50 level, we’ll head back down to the 20-day moving average, around $7.80, which wouldn’t be so bad as I would think some consolidation is in order before a major move up to $9.60.
Keep an eye out for some volatility here, but I’m liking how SZYM is setting up for 2013.
It should be noted that all transactions described on this blog were performed on the Investopedia Stock Simulator and not in the real stock market. I have no actual positions in any stocks mentioned nor will I be initiating any actual positions in the next 6 months. Furthermore, the information on this blog should not be considered financial advice. The main purpose of the blog is to educate its readership, myself included, about concepts and ideas that were previously unknown to me.
Megaphone Pattern: Volatility ahead
A rare megaphone pattern is setting up in the S&P 500 Chart. When stock prices make higher highs and lower lows, it generally signals that there is a great deal of uncertainty (and subsequent volatility) in the markets. You usually want to look for a breach of the widening trend lines for a indicator for longer term direction.

S&P 500 30 min Chart, freestockcharts.com
The austerity crisis has been temporarily averted, and, as expected, the markets reacted accordingly by breaking through previous levels of resistance.

S&P 500 Daily Chart, freestockcharts.com
January saw multi-year highs being made and is currently at levels not seen since 2007 (!). With all this seemingly good news with the Dow breaching 13,000, there have obviously been numerous headlines exclaiming now is the time to jump back into the markets. Indeed, January saw a large influx of funds from retail investors. Unfortunately, I just can’t see how it’s a good time to jump back into the market.
For the bulls, we’ll need to see a breach of resistance at $1514.96 to see highers highs be made since we failed to make higher highs on 2/5. Just keep in mind to protect gains in case of a break of support at around $1493 means, which means we’re heading down for a retracement.
It should be noted that all transactions described on this blog were performed on the Investopedia Stock Simulator and not in the real stock market. I have no actual positions in any stocks mentioned nor will I be initiating any actual positions in the next 6 months. Furthermore, the information on this blog should not be considered financial advice. The main purpose of the blog is to educate its readership, myself included, about concepts and ideas that were previously unknown to me.
